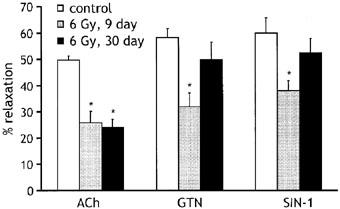
Figure 4.

Histogram comparing maximum relaxation responses to 10 μM ACh, 10 μM GTN and 10 μM SIN-1 in vessels from control animals (open bars) and animals exposed to 6 Gy radiation either 9 (grey bars) or 30 days (black bars) earlier. The number of animals employed was six for each drug, with 14 rings tested in each condition. Relaxations are expressed as per cent decrease in the tension evoked by 10−5 M phenylephrine. *P<0.05 compared with the appropriate response in control rings.
