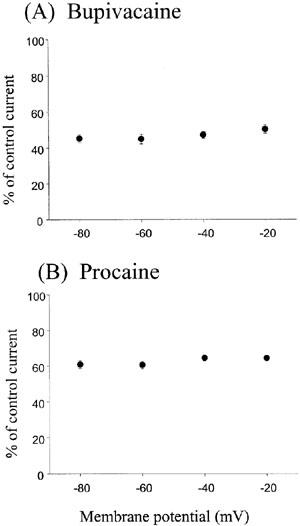
Figure 3.

The effects of bupivacaine and procaine on NMDA/glycine-induced currents in the ε1/ζ1 NMDA receptor at different membrane potentials. The percentages of the control currents induced by NMDA 10 μM/glycine 1 μM NMDA at holding potentials ranging from −80 to −10 mV were plotted in the presence of 1 mM bupivacaine (A) and 1 mM procaine (B). No significant difference (P>0.05, ANOVA) was observed at four different potentials, showing no voltage dependency for both local anaesthetics. Each datum point shows the average for five oocytes and is expressed as the mean±s.e.mean.
