
Figure 2.
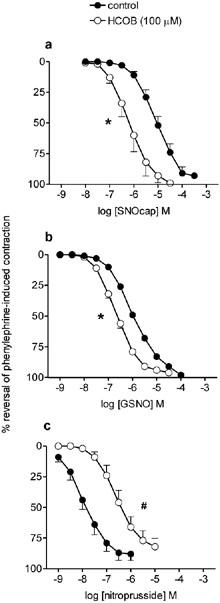
Mean concentration response curves to (a) S-nitrosocaptopril (SNOcap), (b) S-nitrosoglutathione (GSNO) and (c) nitroprusside on rat main pulmonary artery pre-contracted with phenylephrine in the absence (control; closed symbols) and then in the presence (open symbols) of hydroxocobalamin (HCOB; 100 μM; pre-incubation 3 min). Relaxation responses are expressed as per cent reversal of the phenylephrine-induced contraction. Points are mean values (n=4) with s.e.mean shown by vertical bars except when smaller than the size of the symbols. *Significant potentiation or #significant inhibition of responses in the presence of HCOB (P<0.05; based on significant changes in pIC50; see Table 2).