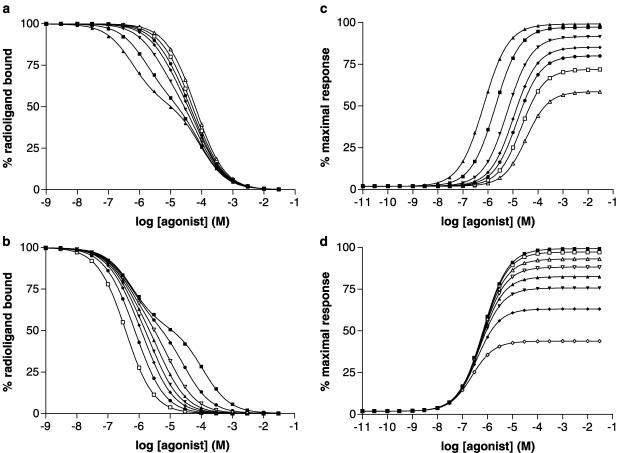
Figure 6.
Simulation of agonist binding and G protein activation according to the Ternary Complex Model. The Ternary Complex Model (Figure 2) was used as described in the Methods section, and two simulations were performed with values of parameters as follows: Simulation 1: KA 104 M−1; KAG (M−1) 108, 3.33 × 10⁷, 107, 5 × 10⁶, 3.33 × 10⁶, 2 × 10⁶, 106; J 108 M−1; [R]=2 × 10⁻¹⁰ M, [G]=10−10 M. Simulation 2 KA (M−1) 8 × 10³, 3 × 10⁴, 8 × 10⁴, 1.5 × 10⁵, 2.5 × 10⁵, 4 × 10⁵, 8 × 10⁵, 2 × 10⁶; KAG 108 M−1; J 108 M−1; [R]=2 × 10⁻¹⁰ M, [G]=10−10 M. Data from the two simulations are given in Table 5 and the derived parameters were amalgamated in subsequent analyses (Figure 7 and Figure 8). Panels a and b (simulations 1 and 2, respectively) show agonist binding expressed as percentage inhibition of the binding of a radioligand that does not discriminate coupled and uncoupled forms of the receptor at a radioligand concentration much less than its dissociation constant. Panels c and d (simulations 1 and 2, respectively) show agonist activation of G proteins with response (E) expressed as a percentage of the maximal response in the system.

