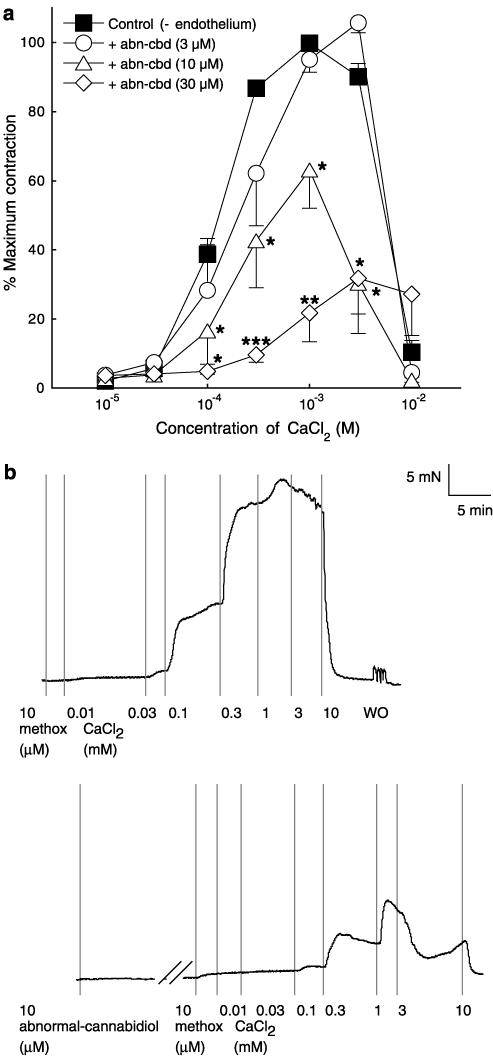
Figure 7.
(a) Concentration–response curves for CaCl2-induced contractions of methoxamine (10 μM)-stimulated rat isolated small mesenteric arteries depleted of intracellular Ca2+ stores with EGTA as described in Methods. All vessels were denuded of endothelium. Contractions to CaCl2 were determined in the absence (n=12) or presence of 3 μM (n=4), 10 μM (n=4) or 30 μM (n=4) abnormal-cannabidiol (abn-cbd) in a given vessel. Control response curves were pooled for clarity. Values are shown as means and vertical lines represent s.e. mean. Statistical comparisons were made by paired t-test at individual concentrations. *P<0.05, **P<0.01, ***P<0.001 indicate significant differences from control values. (b) Shows an original recording of CaCl2-induced contractions in the absence and presence of 10 μM abn-cbd. Vertical lines denote addition of drugs at the concentration indicated. WO denotes wash out with Ca2+-free Krebs–Henseleit solution.

