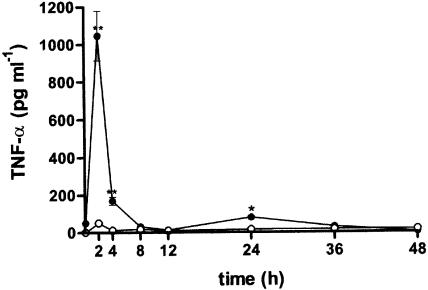
Figure 7.
Time course of TNF-α levels in exudates of the mouse air pouch. Each point is the mean±s.e. mean (n=6–12 animals). Closed symbols represent the values observed for zymosan-injected air pouches and open symbols for saline-injected air pouches. **P<0.01; *P<0.05 with respect to saline-injected air pouches.

