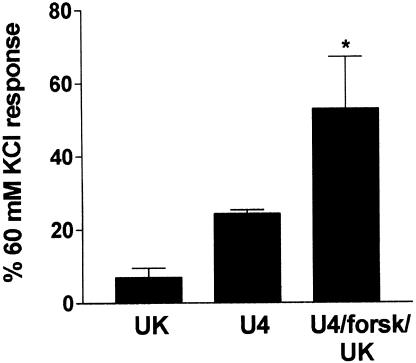
Figure 1.
Bar chart showing contractions to 1 μM UK14304 in segments of porcine ear artery in the absence (UK), or after precontraction with U46619 (<25% of the 60 mM KCl response) followed by relaxation back to baseline with forskolin (0.1–0.3 μM) (U4/forsk/UK). Also shown is the average precontraction obtained with U46619 prior to addition of forskolin (U4). Responses are expressed as a percentage of the response to 60 mM KCl, and are mean±s.e.m. of seven experiments. * Indicates significant difference from 1 μM UK14304 alone (P<0.05, Wilcoxon signed rank test).

