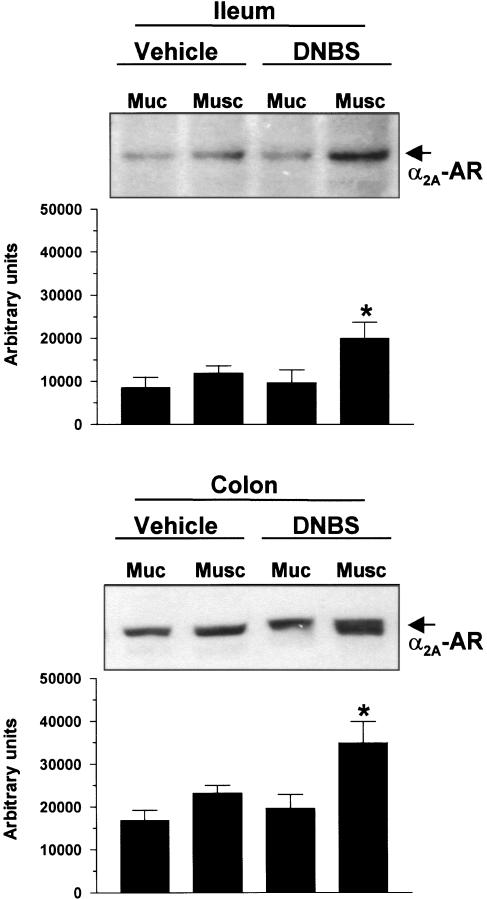
Figure 6.
Western blot analysis of α2A-adrenoceptor (α2A-AR) expression in mucosal (Muc) and muscular (Musc) layers of ileum or colon isolated from animals in the absence (vehicle) or in the presence of DNBS-induced colitis (DNBS). Each panel displays a representative blot and a column graph referring to the densitometric analysis of immunoreactive bands. Each column represents the mean of four separate experiments±s.e.m. (vertical bars). Significant difference from the respective values obtained in vehicle-treated animals: *P<0.05.

