Figure 6.
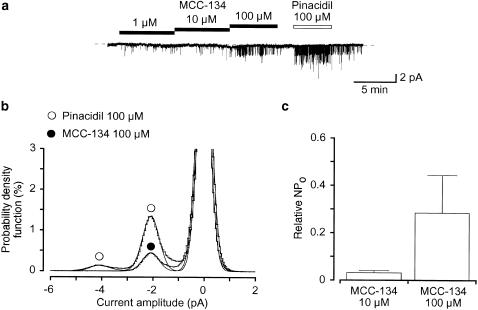
The MCC-134-induced opening of K+ channels recorded with cell-attached configuration at a holding membrane potential of −50 mV. (a) Comparison of the properties of the MCC-134 (1–100 μM) activated K+ channels and the 100 μM pinacidil induced K+ channels in the same membrane patch at −50 mV. The dashed line indicates the current when the channel is not open. (b) All-point amplitude histograms in the presence of 100 μM MCC-134 and 100 μM pinacidil (obtained during 1 min). Continuous lines in the histograms are theoretical curves fitted with the Gaussian distribution, by the least-squares method. The abscissa scale is the amplitude of the current (pA) and the ordinate scale is the percentage value of the probability density function (%) for the recording period (1 min). (c) Each column shows the relative level of the activity of the MCC-134-induced KATP channel (mean value with +s.d.) when the mean amplitude of the pinacidil-induced channel activity was normalized as one (n=4).

