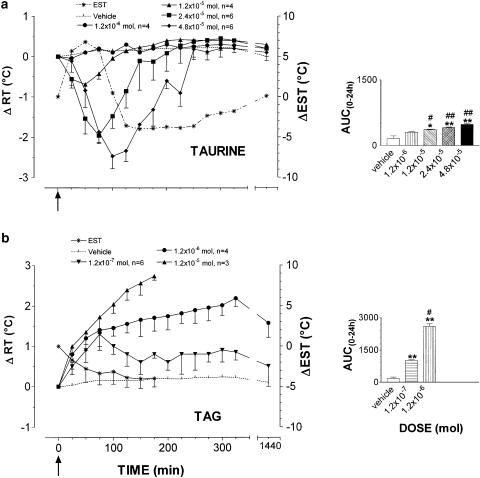
Figure 1.
Mean (± s.e.m.) changes in rabbit rectal- (RT) and ear–skin temperature (EST) following i.c.v. administration of taurine (panel a) and TAG (panel b). The doses injected for taurine were 1.2 × 10⁻⁶ (•, n=4), 1.2 × 10⁻⁵ (▴, n=4), 2.4 × 10⁻⁵ (▪, n=6) and 4.8 × 10⁻⁵ mol (⧫, n=6); for TAG 1.2 × 10⁻⁷ (▾, n=6), 1.2 × 10⁻⁶ (•, n=4), 1.2 × 10⁻⁵ (▴, n=3) mol. Vehicle alone (pyrogen-free water, dotted line) was injected at the same volume used for the compounds to a group of six rabbits. EST was measured in animals treated with the highest dose (*, dotted line). To improve clarity, s.e.m. of vehicle RT values and EST values are not depicted. Arrows indicate time of i.c.v. injection. In the right panels, the area under the experimental curve (AUC(0–24 h)) of RT changes relative to each dose/compound is shown. The comparison between AUC(0–24 h) of vehicle- vs taurine- or TAG-injected rabbits or between AUC(0–24 h) of the different doses of each compound was performed by using Student's t-test. *P<0.05, **P<0.01, ***P<0.001 vs vehicle. #P<0.05, ##P<0.01 vs the previous dose.

