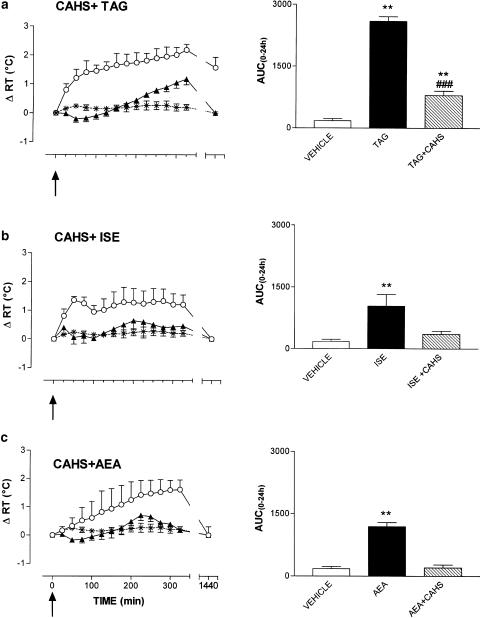
Figure 5.
Effects of CAHS on TAG-, ISE- and AEA-induced hyperthermia. Data are reported as mean ±s.e.m. of changes in rabbit RT. Black triangles represent the effects of CAHS (4.8 × 10⁻⁵ mol) injected 10 min before TAG (1.2 × 10⁻⁶ mol, n=4, panel a), ISE (4.8 × 10⁻⁵ mol, n=4, panel b) or AEA (1.2 × 10⁻⁸ mol, n=4, panel c), while open circles represent the hyperthermia elicited by TAG, ISE or AEA injected alone. Arrows indicate time of TAG, ISE or AEA i.c.v. injection. In the right panels, the area under the experimental curve (AUC(0–24 h)) of RT changes relative to the different treatments is shown. The comparison between AUC(0–24 h) relatives to the different treatments was performed by using Student's t-test. **P<0.01 vs vehicle. ###P<0.001 vs TAG, ISE or AEA alone.

