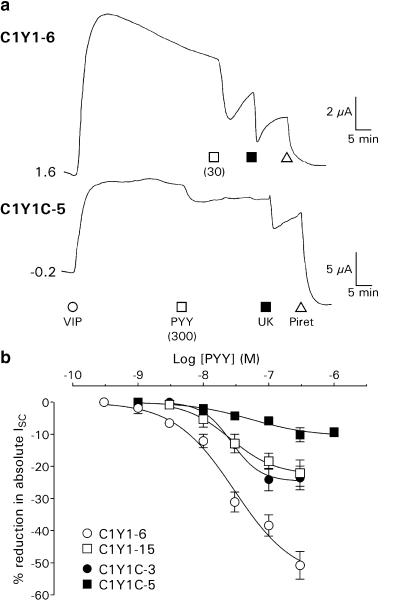
Figure 6.
(a) Example ISC traces from the C1Y1 and C1Y1C clones. C1Y1-6 or C1Y1C-5 epithelial layers (0.2 cm2 area, on different vertical scales) were treated with 30 nM VIP, followed by PYY (at the concentration (nM) indicated), 1 μM UK and 200 μM piretanide (Piret). (b) PYY concentration–response curves in C1Y1-6 (n=3–8), C1Y1-15 (n=3–6), C1Y1C-3 (n=3–7) and C1Y1C-5 (n=2–8) epithelial layers prestimulated with 30 nM VIP. Each point represents the mean±1 s.e.m. of n individual peak responses to a single concentration of PYY, expressed as a percentage of the total ISC (including basal and VIP-induced components). Fitted sigmoid curves yielded the pEC50 values presented in Table 2 and Hill coefficients of −0.9 (C1Y1-6, C1Y1C-5), −1.3 (C1Y1-15) and −1.9 (C1Y1C-3).

