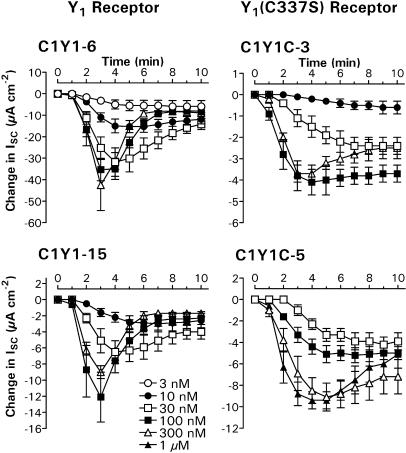
Figure 7.
Y1 and Y1(C337S) receptor-mediated responses in epithelial layers stimulated with 30 nM VIP. Mean PYY-induced changes in ISC are shown over a 10 min period for each of the four clones, following agonist addition (t=0) at concentrations of 3 nM (n=4), 10 nM (n=4–5), 30 nM (n=4–8), 100 nM (n=5–8), 300 nM (n=3–4) or 1 μM (n=4). Note the changes in vertical scale for each graph.

