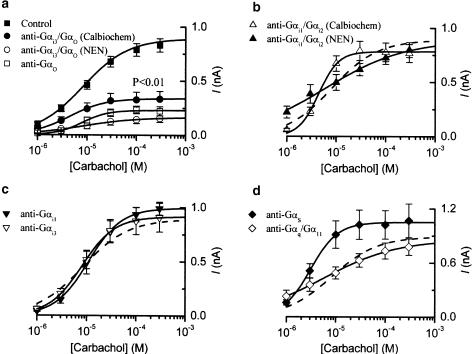
Figure 3.
Summary of results of experiments where antibodies to various G-protein α subunits were added to the pipette solution. mIcat was measured in the same way as shown in Figure 2, and its amplitude was plotted against the carbachol concentration on a logarithmic scale. Control data (n=53) are shown in (a) and as a dotted line in (b–d) for comparison. (a) Gαi3/Gαo antibodies (Calbiochem, n=9; NEN™, n=10) and Gαo antibodies (Calbiochem, n=7); (b) Gαi1/Gαi2 antibodies (Calbiochem, n=6; NEN™, n=10); (c) Gαi1 antibodies (Calbiochem, n=6) and Gαi3 antibodies (Calbiochem, n=8); (d) Gαs antibodies (Calbiochem, n=6) and Gαq/Gα11 antibodies (NEN™, n=13). All antibodies were used at 1 : 200 v v−1 dilution, except for Gαi1/Gαi2 and Gαq/Gα11 antibodies from NEN™ where 1 : 100 v v−1 dilution was used. Each point indicates the mean±s.e.m. (vertical bars). The individual sets of points were fitted by the Hill equation (see Methods) with the parameters shown in Table 2. Significant difference in the group mean from the control mean value occurred only for Gαi3/Gαo and Gαo antibodies (Table 3).

