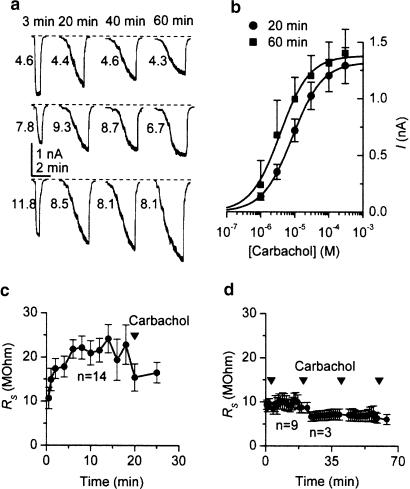
Figure 5.
Lack of mIcat inhibition in cells which were briefly exposed to 100 μM carbachol at 3 min after breakthrough and dialysed with Gαo antibodies. (a) Examples from three cells; the numbers next to each trace indicate Rs values (MΩ) which were measured shortly before. (b) Averaged concentration–effect curves measured at 20 min (n=6) and at 60 min (n=3) in the presence of the antibodies after carbachol exposure at 3 min. Fitted parameters were as follows: Imax 1.322 and 1.380 nA, EC50 8.5 and 3.7 μM and slope 1.0 and 1.0 at 20 and 60 min, respectively. (c) Changes in series resistance with time during whole-cell recording from 14 cells. The application of carbachol (1–300 μM) after 20 min is indicated by triangles. (d) Changes in series resistance with time of recording and following carbachol application (single 100 μM concentration at 3 min; later application 1–300 μM). Up to 20 min, nine cells were averaged; three cells were held for longer periods. Series resistance was measured before applications of carbachol and tended to be reduced in periods following an application.

