Figure 5.
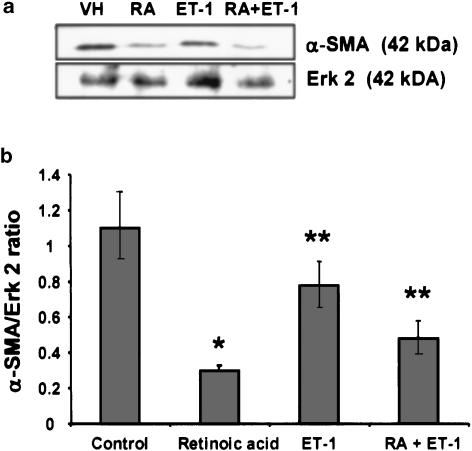
Western analysis of α-SMA. After treatment with retinoic acid (2.5 μM) or the vehicle (ethanol, 1 μl ml−1) without or with 50 nM ET-1 for 10–12 days, cells were lysed and Western blotting analysis for α-SMA was performed. (a) A representative blot showing the effect of various conditions on α-SMA expression. As a nonvariant protein the expression of Erk 2 was determined in equal amount of total protein. (b) Densitometric analysis of the intensity of the α-SMA bands is presented as a ratio against the intensity of Erk 2 bands. Averages of three determinations±s.e.m. *P<0.001 and **P<0.01 vs vehicle. RA, retinoic acid.

