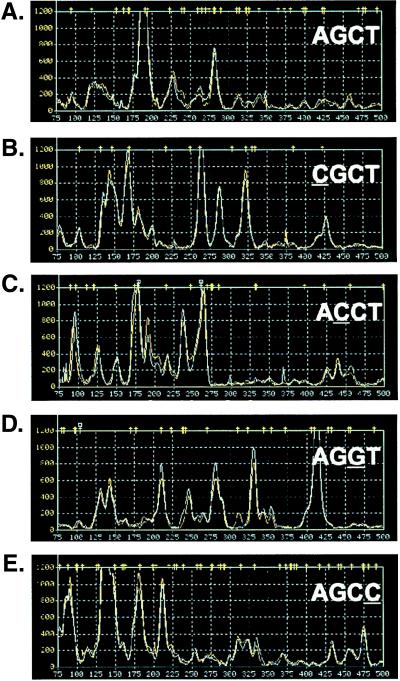
Figure 3.
TOGA reproducibility and primer specificity. Product pool profiles generated by AGCT and single nucleotide variants at each of the four locations within N1N2N3N4; the varied nucleotide is underlined. The 1,200-unit amplitude scale has been selected for the y axis. Each trace shows the overlay of the product profiles from two independent libraries generated from the same RNA sample prepared from serum-depleted human osteosarcoma cells.

