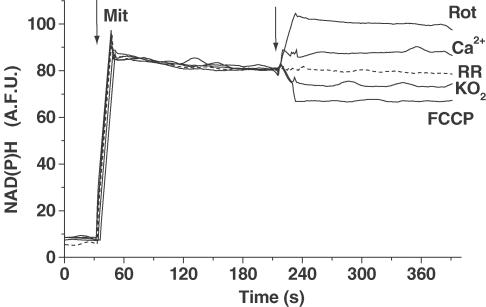
Figure 3.
Effect of KO2 and Ca2+ on mitochondrial NAD(P)H levels. NAD(P)H levels were monitored spectrofluorimetrically as described in methods. After 60 s of base line, intact mitochondria (500 μg) were added. Arrow indicates CaCl2 (15 μmol mg−1 mit; Ca2+), KO2 (5 μmol mg−1 mit; KO2), rotenone (10 μM, Rot), and FCCP (1 μM, FCCP) additions. Dashed line represents mitochondria preparation preincubated for 15 min in the presence of Ruthenium Red (5 μM; RR) before CaCl2 addition. One single experiment is shown, but similar data were found in four to six different mitochondrial preparations.

