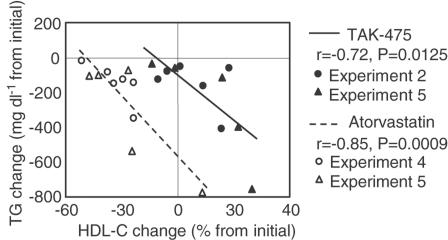
Figure 5.
Correlation between changes in plasma HDL cholesterol (percentage change from initial levels) and plasma triglyceride (mg dl−1 change from initial levels) in TAK-475 (100 mg kg−1)- and atorvastatin (30 mg kg−1)-treated common marmosets. Data from experiments 2, 4 and 5 (shown in Table 2 and Figure 4) are plotted. Solid symbols indicated TAK-475-treated marmosets (n=11). Clear symbols indicate atorvastatin-treated marmosets (n=11).

