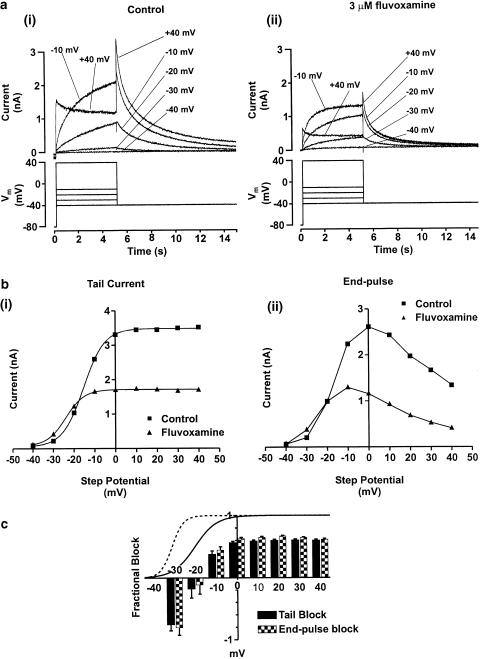
Figure 3.
Voltage-dependent modulation of IHERG by 3 μM fluvoxamine. Panel (a) shows representative IHERG traces recorded in the absence (ai) and presence (aii) of 3 μM fluvoxamine. Currents (upper traces) were evoked in response to a series of incremental step depolarisations between −40 and +40 mV from a holding potential of −80 mV (lower traces). For clarity, not all steps are shown. Panel (b) shows the complete current–voltage relations for the IHERG tail current (bi) and the end-pulse current (bii) from the cell shown in panel (a). Data are shown in control and in the presence of 3 μM fluvoxamine. IHERG tails were measured as the peak current evoked on repolarisation to −40 mV relative to the holding current at −80 mV. The isochronal end-pulse current was measured as the current amplitude at the end of the conditioning voltage step prior to repolarisation to −40 mV. Tail currents were fitted with a Boltzmann sigmoidal function (see Equation (3), Methods). The values for V0.5 in control and drug for this cell were −15.4±0.2 and −24.0±0.3 mV, respectively. Values for k in control and drug were 5.1±0.1 and 4.5±0.3 mV, respectively. Panel (c) shows mean data of the voltage dependence of fractional block of IHERG tails (filled bar) and end-pulse current (hatched bars) (ANOVA with a Bonferroni post-test, # denotes P<0.001 for post-test pairwise comparison with steps to ⩾−10 mV, * denotes P<0.05 for post-test pairwise comparison with voltage steps ⩾0). Superimposed are the normalised Boltzmann functions describing voltage-dependent activation of the IHERG tails in control (solid line) and in the presence of 3 μM fluvoxamine (dashed line). Application of fluvoxamine shifted the mean half-maximal activation voltage (V0.5) by ≈−10 mV (see also ‘Results' text).

