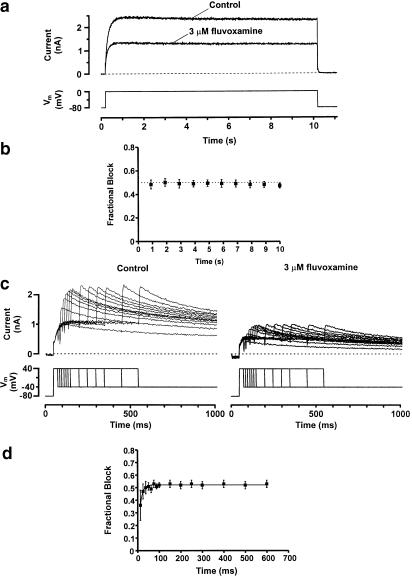
Figure 4.
Time-dependence of IHERG blockade by fluvoxamine. Panel (a) shows typical long pulse current traces recorded in a cell expressing HERG. The cell was repeatedly stepped from a holding potential of −80 to 0 mV for 10 s (lower trace) to evoke stable steady-state currents (upper trace). Stimulation was then terminated and the cell was allowed to equilibrate in 3 μM fluvoxamine for >3 min, while being held at −80 mV. The cell was then subjected to the same voltage command. Traces immediately prior to and the first step following the application of 3 μM fluvoxamine are shown. Panel (b) shows the mean data (±s.e.m.) for the experiment in panel (a) using six cells. Time zero coincides with the voltage step from −80 to 0 mV. Following development of full block (which occurs within 1 s), no time-dependent change was observed. The intermittent straight line at 0.5 is shown for comparison. Panel (c) shows representative current traces evoked by an envelope of tails protocol. Cells were held at −80 mV and stepped to +40 mV for 25–600 ms and then tail currents were evoked on repolarisation to −40 mV. Peak tail currents at each time point were measured. Representative current traces were recorded in the same cell under control conditions and in the presence of 3 μM fluvoxamine. Panel (d) shows mean data (±s.e.m.) from seven cells for the envelope of tails experiments. Fractional blockade of the HERG tail current was plotted as a function of the depolarising pulse duration. Block developed mono-exponentially with a t1/2 of 7.5 ms.

