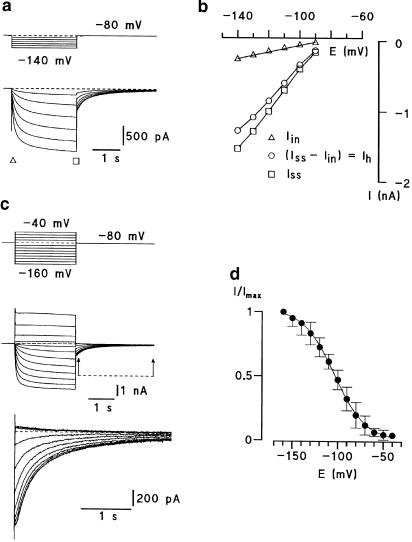
Figure 1.
Hyperpolarizing-activated inward current (Ih) recording in dorsal root ganglion neurones. (a) Hyperpolarizing voltage commands elicited an initial current, referred to as the instantaneous currents (Iin, triangle) proceeded by a steep capacity current and followed by the development of a slow inward current reaching a steady-state level at the end of the voltage command (Iss, square). (b) Iin, Ih (circle) and Iss are plotted as a function of membrane potential. The amplitude of Ih was given as difference of the slow inward and instantaneous currents (Ih=Iss−Iin). The data were fitted by eye. (c) Activation curves of Ih current. Whole-cell recordings from de- and hyperpolarization-activated currents evoked from −80 mV to different test potentials. Tail-current relaxations are indicated by arrows and are shown at higher resolution in the lower sets of traces. (d) Normalized peak relaxation currents were fitted with the Boltzmann equation: 1/(1+exp(−(E−E50)/k)).

