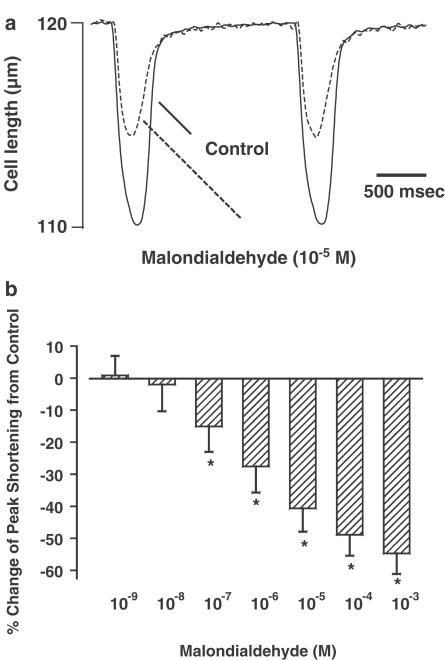
Figure 1.
(a) Representative traces depicting the effect of malondialdehyde (10−5 M) on cell shortening in ventricular myocytes. (b) Concentration-dependent response of malondialdehyde (10−9–10−3 M) on peak cell shortening. Data are presented as percent change from basal PS, which was 9.22±0.83%. Mean±s.e.m., n=22 per data group, *P< 0.05 vs baseline value.

