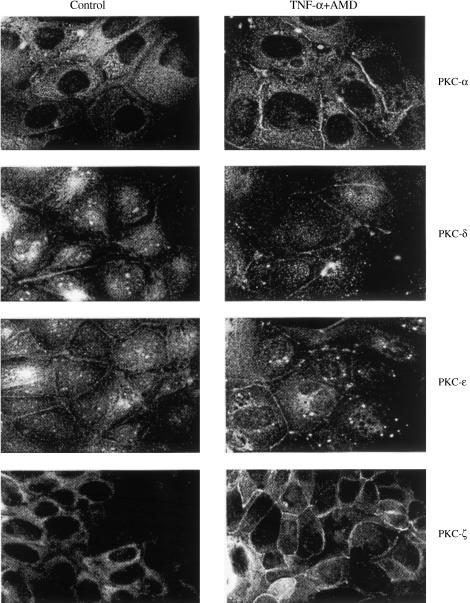
Figure 2.
Immunofluorescent localization of PKC isoforms in SCBN cells treated with TNF-α in the presence of 0.2 μg ml−1 AMD or in untreated control cells. Cells were harvested 18 h after treatment. Control cells showed primary cytosolic distribution of PKCα, δ, ɛ and ζ and faint peripheral staining for PKCα, δ and ɛ. TNF-α-treated SCBN cells displayed intensified staining for PKC-α in both cytosolic and membrane fractions. PKC-δ and ɛ showed only increased peripheral staining (magnification, × 815).

