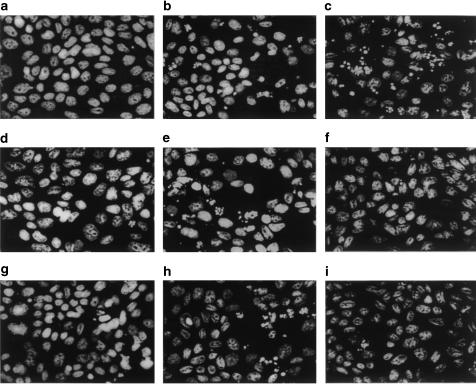
Figure 5.
Fluorescent micrographs of apoptosis of SCBN cells induced by TNF-α in the presence or absence of PKC isoenzyme peptide inhibitors and activators. Nuclear condensation and fragmentation were detected by staining with Hoescht 33258, and the cells were observed under a high-power fluorescent microscope (× 40) with optical filter. (a) Control; (b) the cells exposed to TNF-α in the presence of AMD; (c) the cells treated with TNF-α and PMA; (d) GF109203X-treated cells exposed to TNF-α; (e) Rottlerin-treated cells exposed to TNF-α; (f) ɛ-V1-2 translocation inhibitor-treated cells exposed to TNF-α; (g) cPKC specific antagonist pp95-treated cells exposed to TNF-α; (h) δ-PKC specific antagonist pp101-treated cells exposed to TNF-α; (i) ɛ-PKC (pp93) specific antagonist-treated cells exposed to TNF-α.

