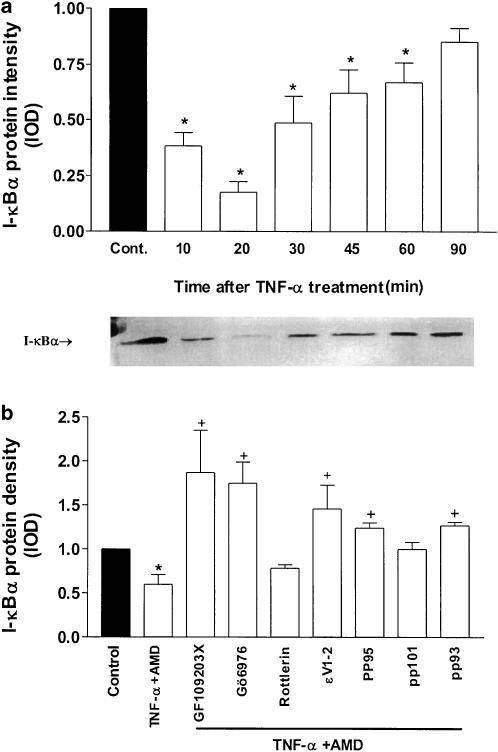
Figure 6.
Effect of TNF-α in combination with PKC antagonist peptides on I-κBα protein expression in SCBN cells. (a) I-κBα protein levels in SCBN cells treated 10–90 min with TNF-α. A representative autoradiogram of SCBN cells treated with TNF-α is displayed below the figure. (b) Effects of administration of selective and nonselective PKC inhibitors on I-κBα protein levels. Histogram values represent the means±s.e. of data from three separate experiments. *P<0.05, significant difference compared with control groups, +P<0.05, significant differences compared with TNFα+AMD-treated groups.

