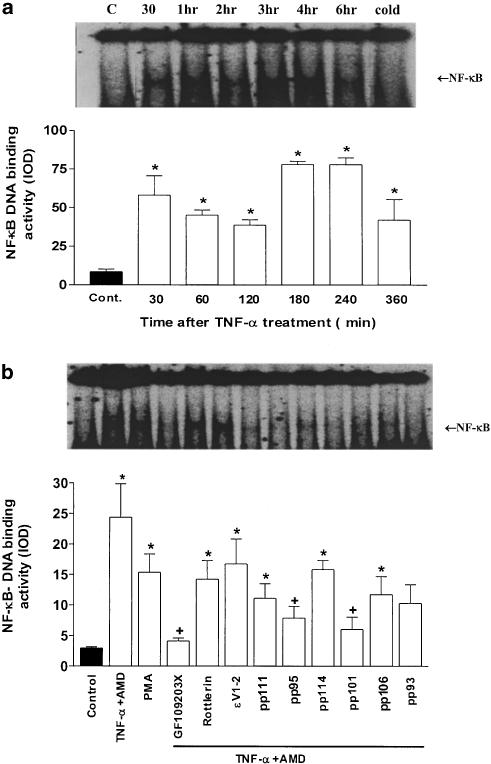
Figure 8.
Effect of selective and nonselective PKC isoenzyme activators and inhibitors on NF-κB-binding activity in TNF-α-treated or control SCBN cells. (a) The mean±s.e. NF-κB activity as determined 0–360 min after the treatment. A representative autoradiogram of this experiment is shown above this figure. The effect of incubation of the cellular lysate with an excess of unlabelled (cold) oligonucleotide is also shown in the most right lane of this autoradiogram. (b) The mean (±s.e.) effect of PKC isoenzyme activators and inhibitors on NF-κB-binding density in response to TNF-α treatment. The representative autoradiogram for this experiment is displayed above the figure. Histogram values are the means±s.e. of data from three separate experiments, *P<0.05 compared to control group; +P<0.05 compared to group treated with TNF-α (+AMD) alone.

