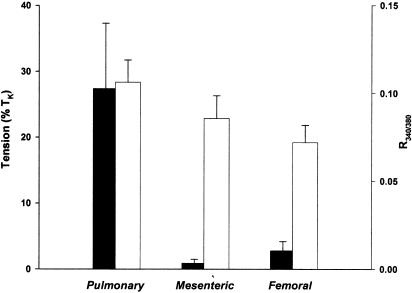
Figure 5.
Summary of CCE-related tension development and [Ca2+]i in IPA, MA, and FA. Effects of reapplication of extracellular Ca2+ following Thg treatment on tension development and [Ca2+]i obtained in individual IPA (n=5), MA (n=6), and FA (n=4) during experiments similar to those shown in Figure 4. The mean±s.e.m. of these responses are shown, with the solid bars representing tension (left axis) and the open bars representing the increase in [Ca2+]i, expressed in terms of the raw R340/380 values (right axis).

