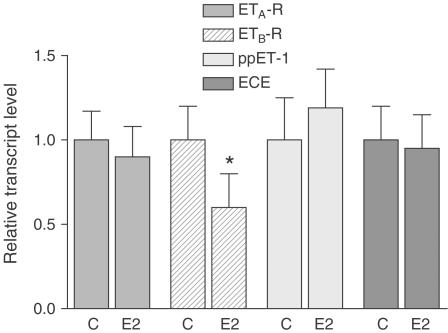
Figure 4.
Relative expression of ETA-R, ETB-R, ppET-1 and ECE in neonatal cardiomyocytes in response to E2. Cells were stimulated for 24 h with E2 (10−8 M) or vehicle alone (C=control). PCR results were normalized for each target gene to control cells in such a manner that the mean expression of control equals a value of 1. The expression level of ETB-R mRNA was significantly downregulated due to E2 treatment, whereas there was no significant difference concerning expression levels of ETA-R, ECE and ppET-1. Results are mean±s.d. from three experiments (n=3, *P<0.005 vs control).

