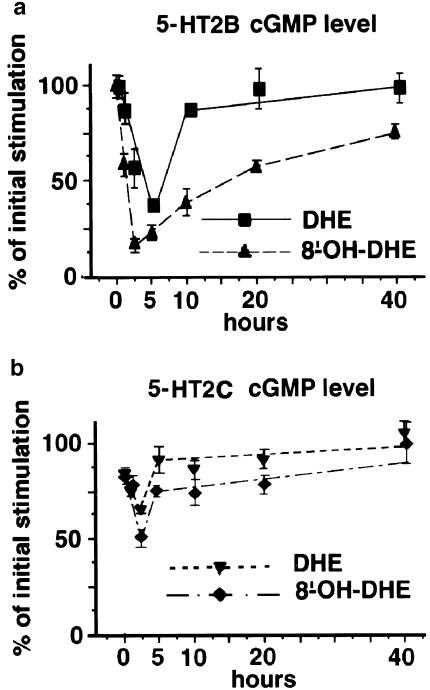
Figure 4.
Time course of the cGMP levels obtained on 5-HT2B and 5-HT2CRs-expressing cells after chronic exposure. Data points expressed as per cent of maximal stimulation represent the average of the cGMP level measured at 5-HT2B (a) and 5-HT2C (b) receptor-expressing cells at each time point after exposure to saturating concentrations of DHE or 8′-OH-DHE and are the average of at least three experiments performed in triplicate.

