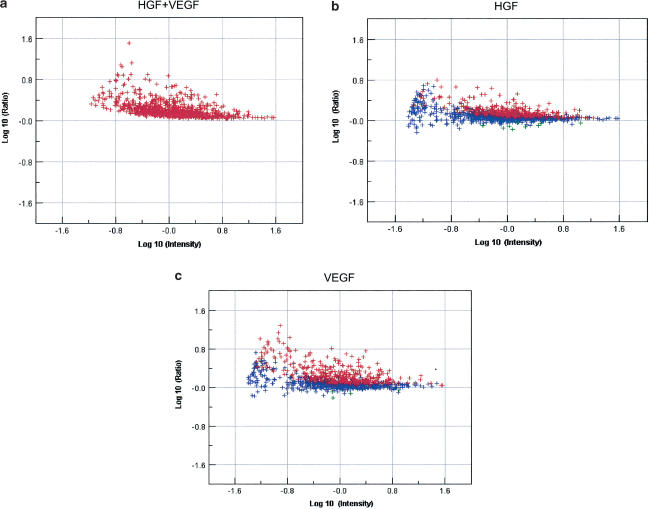
Figure 2.
Dot plot representation of the expression of 566 probes upregulated by more than 1.5-fold, P<0.1 at 4 h, in the presence of the combination of HGF and VEGF at 4 h. The same probesets were compared to the expression data for HGF alone (b) and VEGF alone (a) at 4 h. Blue denotes not significantly changed from basal and red, significantly upregulated over basal expression.

