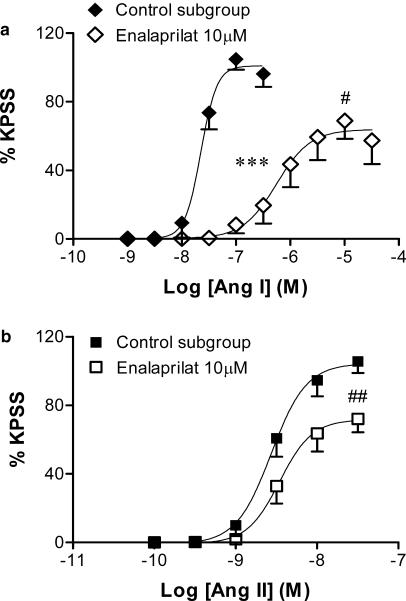
Figure 3.
Effect of enalaprilat (10 μM) on the mean log CR curves to (a) angiotensin I (n=6) and (b) angiotensin II (n=7–8) in uterine arteries from nonpregnant rats. Responses are expressed as a % of the maximum response to KPSS; values are means and vertical lines represent s.e.m.; ***P<0.001 versus control EC50. #P<0.05, ##P<0.01 versus control maximum response.

