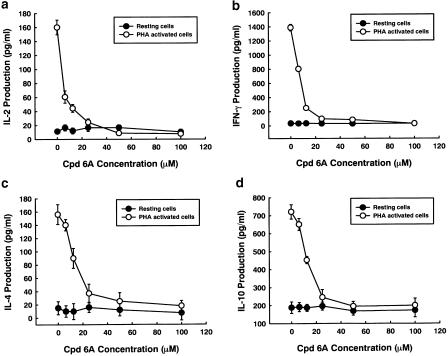
Figure 5.
Cytokine production in T lymphoctyes treated with Cpd 6A. T cells (2 × 10⁵ well−1) were treated with 0, 6.25, 12.5, 25, 50, or 100 μM of Cpd 6A with or without PHA (5 μg ml−1) for 3 days. Then, the cell supernatants were collected and IL-2 (a), IFN-γ (b), IL-4 (c), and IL-10 (d) concentration was determined by EIA, respectively. Each point is the mean of three independent experiments.

