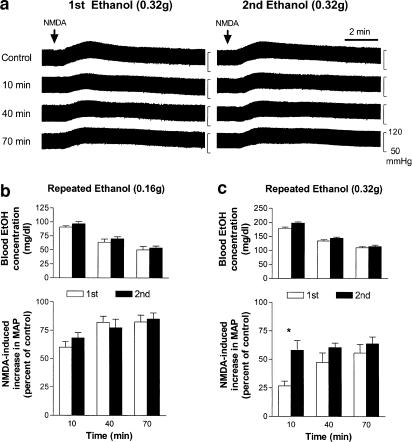
Figure 6.
The effects of repeated applications of ethanol (EtOH) on NMDA-induced increases in blood pressure in urethane-anesthetized rats. (a) Representative recordings show the effects of two intravenous injections of ethanol given at intervals of 3.5 h on NMDA-induced pressor effects at different times after the injection. NMDA (2 nmol, indicated by an arrow) was applied i.t. every 30 min to exert an increase in blood pressure. (b) Bar graphs show blood ethanol concentrations (top part, n=8) and percentage changes in NMDA-induced increases in MAP (bottom part, n=10) following the first (1st, clear bars) and the second (2nd, black bars) injections of 0.16 g ethanol. The peak magnitude of NMDA-induced increase in MAP immediately prior to the application of ethanol is taken as control (i.e. 100%); the NMDA-induced increases in MAP were 20.7±1.7 and 18.9±2.3 mmHg (n=10) before the first and the second applications of ethanol (0.16 g), respectively. (c) Bar graphs show blood ethanol concentrations (top panel, n=9) and percentage changes in NMDA-induced increases in MAP (bottom panel, n=6) following the first (1st, clear bars) and the second (2nd, black bars) injections of 0.32 g ethanol. The NMDA-induced increases in MAP were 20.3±2.7 and 18.9±2.6 mmHg (n=6) before the first and the second applications of ethanol (0.32 g), respectively. *Significant difference between two groups analyzed by two-way ANOVA followed by Bonferroni post-test.

