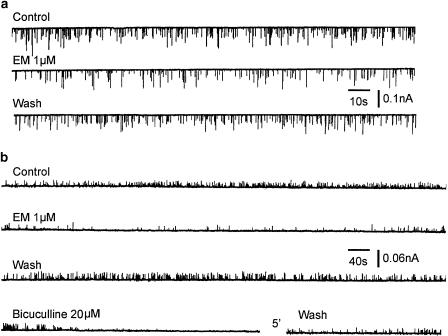
Figure 11.
Effects of EM-1 on miniature EPSCs and miniature IPSCs of SG neurons. (a) Chart recordings of mEPSCs, in the presence of TTX (0.3 μM), strychnine (1 μM) and bicuculline (20 μM), before, during and after the application of EM-1 (1 μM). (b) Representative recordings of mIPSCs before, during and after the application of EM-1 (1 μM), and their block by bicuculline (20 μM); the recordings were made in the presence of TTX (0.3 μM), CNQX (20 μM) and APV (10 μM).

