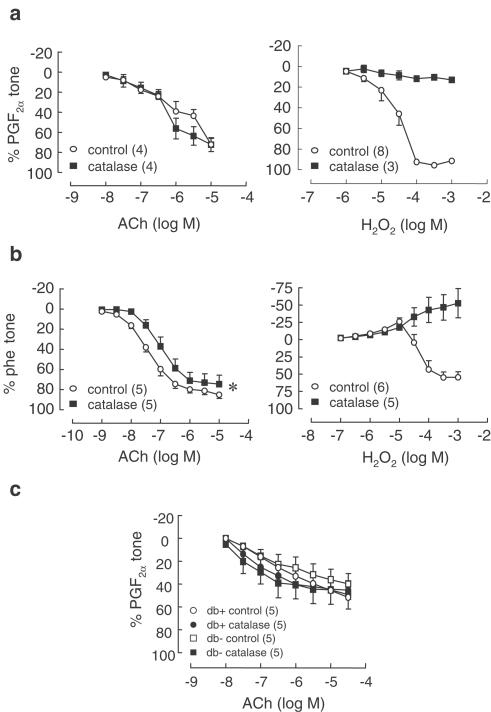
Figure 2.
Effect of catalase (2500 U ml−1) on relaxations to ACh (0.01–10 μM) in (a) SMA and (b) aorta from C57BL/6 mice, and (c) SMA from type II diabetic mice db/db (and respective wild-type controls db +/?; n=5). Relaxations to H2O2 (1–1000 μM) were abolished by catalase in both aorta and SMA. Symbols represent means and t-bars are standard error of means (s.e.m.). *P<0.05 when compared to control (comparison of pEC50 values, paired t-test). Numbers in parentheses refer to number of experiments performed.

