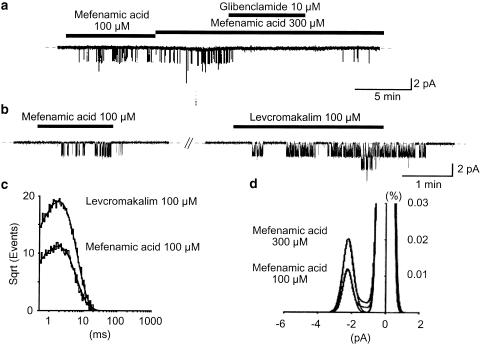
Figure 3.
Effects of mefenamic acid and levcromakalim on the same cell-attached patches in symmetrical 140 mM K+ conditions at −50 mV. Note that mefenamic acid, levcromakalim and glibenclamide were applied in the bath solution. (a)When mefenamic acid was applied in the bath, a small channel (2.14 pA at −50 mV) started to activate. Glibenclamide (10 μM) reversibly inhibited this channel. The dashed line indicates the current base line when the channel is not open. (b) The 2.14 pA channel was activated by mefenamic acid (100 μM) and 100 μM levcromakalim. Levcromakalim (100 μM) was applied 5 min after recovery from mefenamic acid. The dashed line indicates the current base line where the channel is not open. (c) The open lifetime in the presence of 100 μM mefenamic acid and 100 μM levcromakalim at −50 mV. The abscissa shows the logarithmic open lifetime (ms) and the ordinate shows the square root of the number of total events (mefenamic acid, 9382 events; levcromakalim, 16,008 events). The solid curve indicates a single exponential fitting using the least-squares method. The width of the bin was 0.2 ms. The time constant for the mean open lifetime was 1.7 ms (1.7±0.1 ms, n=6, 100 μM mefenamic acid) and 1.8 ms (1.7±0.1 ms, n=6, 100 μM levcromakalim). The data were obtained from 30 s recording and filtered at 2 kHz, with a sampling rate of 80 μs for analysis. (d) All-points amplitude histograms in the presence of 100 and 300 μM mefenamic acid. Continuous lines in the histograms are theoretical curves fitted with a Gaussian distribution function. The abscissa shows the amplitude of the current (pA), and the ordinate shows the percentage value of the probability density function (%).

