Figure 5.
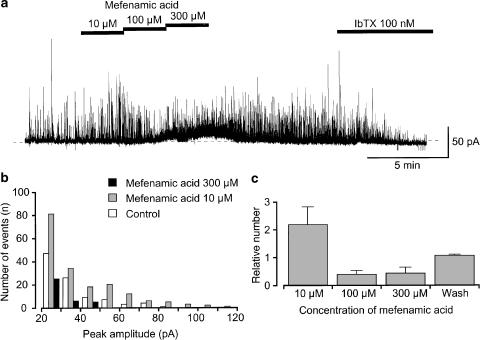
Nystatin-perforated recording of the effects of mefenamic acid (10–300 μM) on the activity of STOCs at –20 mV in the presence of 5 μM glibenclamide. The bath solution was 5 mM K+ PSS, and the pipette solution was 140 mM KCl containing 5 mM EGTA. Note that 5 μM glibenclamide was present in the bath solution throughout the experimental protocol. (a) Current trace of STOCs in the absence and presence of mefenamic acid. Subsequent application of IbTX (100 nM) abolished STOCs. The dashed line indicates the zero current level. (b) Event histograms of STOCs were obtained from the results in (a) in the absence and presence of mefenamic acid (10 μM and 300 μM). The abscissa shows the amplitude of STOCs (pA) and the ordinate shows the number of total events of STOCs for a 2 min recording. Note that amplitudes of STOCs less than 20 pA were omitted from the evaluation. (c) Relative number of STOCs in each concentration of mefenamic acid. By normalizing the total number of STOCs for the 2 min recording just before application of mefenamic acid (control) as one, relative numbers of STOCs were obtained in each concentration of mefenamic acid. Each column indicates the mean of four observations with s.d. Note that amplitudes of STOCs less than 20 pA were omitted from the evaluation.

