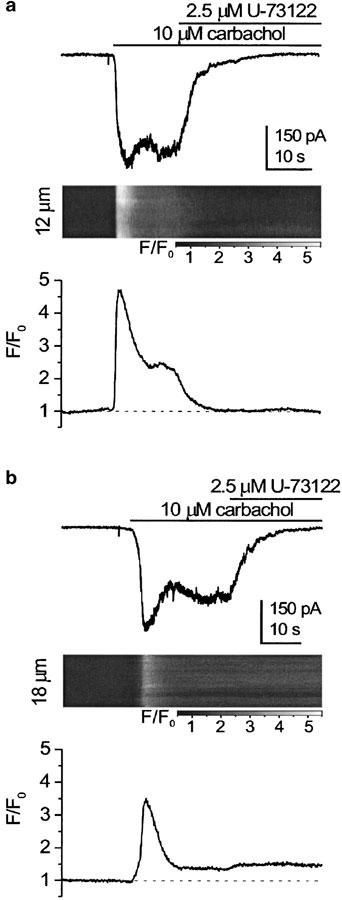
Figure 3.
mICAT (top) and corresponding normalized fluo-3 fluorescence signal acquired in the line-scan mode at 127 Hz (bottom) in two different cells (a, b), both exposed to 10 μM carbachol. The holding potential was −50 mV. Fluo-3 concentration was 100 μM. The fluorescence intensity in the images was normalized to the average fluorescence intensity during the first 1300 lines in each image, and grey scale-coded, as indicated by the bars (F/F0). The plots below the images show the time course of the normalized fluorescence averaged along the whole scan line (in (a) and (b) 12 and 18 μm, respectively).

