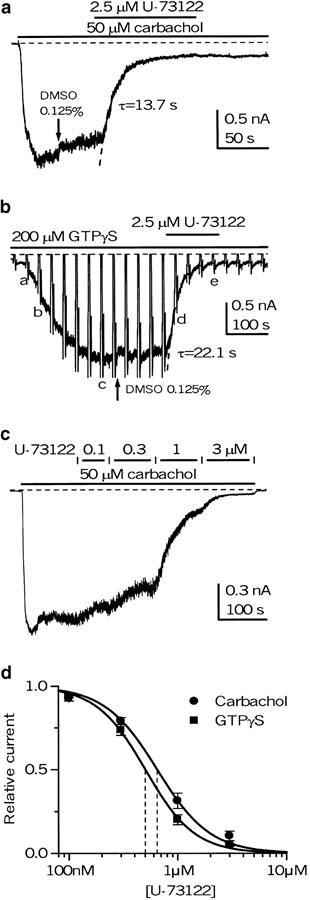
Figure 4.
Inhibition of mICAT under conditions when [Ca2+]i was ‘clamped' at 100 nM using 10 mM BAPTA/Ca2+ buffer. mICAT was activated by 50 μM carbachol (a) or cell dialysis with 200 μM of GTPγS (b), and DMSO at 1 : 800 v v−1 was administered before U-73122 application (as shown by arrows) to account for its small inhibitory effect. Vertical deflections on the current trace in (b) correspond to the moments when the I–V curves were measured by the voltage ramp protocol at 30 s intervals. Superimposed dotted lines in (a, b) show single exponentials fitted to the data points during mICAT inhibition by U-73122, with the time constants indicated. (c) U-73122 was applied cumulatively at ascending concentrations, as indicated at the top, to evaluate the concentration dependence of its effect. (d) Mean relative carbachol- and GTPγS-evoked current amplitude measured at −50 mV (n=7 for both) plotted against U-73122 concentration on a semilogarithmic scale. Data points were fitted by the Hill equation (equation (2)) with an IC50 value of 0.64 μM and Hill slope of 1.8 for carbachol-evoked current and an IC50 value of 0.50 μM and Hill slope of 1.9 for GTPγS-evoked current.

