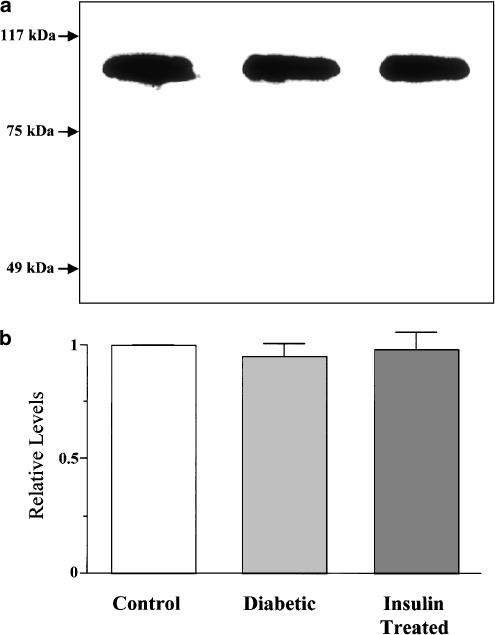
Figure 3.
Western blot analysis of SERCA2a expression levels in microsomal fractions enriched in SR membranes isolated from control, diabetic, and insulin-treated diabetic rat hearts. (a) Representative Western blots showing immunochemical detection of SERCA2a, as a single protein band with an apparent molecular mass of ∼110 kDa. (b) Quantification of SERCA2a expression levels. Note that no significant difference was found among groups. In each of the experiments, the SERCA2a level obtained from the control band is normalized as 1.0. Bars are means±s.e.m. of six separate experiments.

