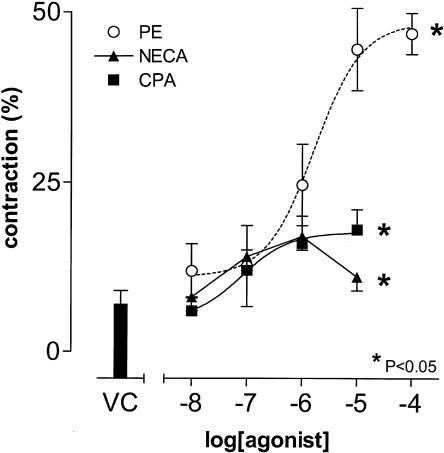
Figure 1.
Effects of CPA and NECA on HCPSC contractility. The concentration response curve to PE described previously (Preston & Haynes, 2003) is included for comparison. The results are expressed as percentage reduction in initial cell length (n=5–8).*Significant when compared to vehicle control (VC) (P<0.05; one-way ANOVA).

