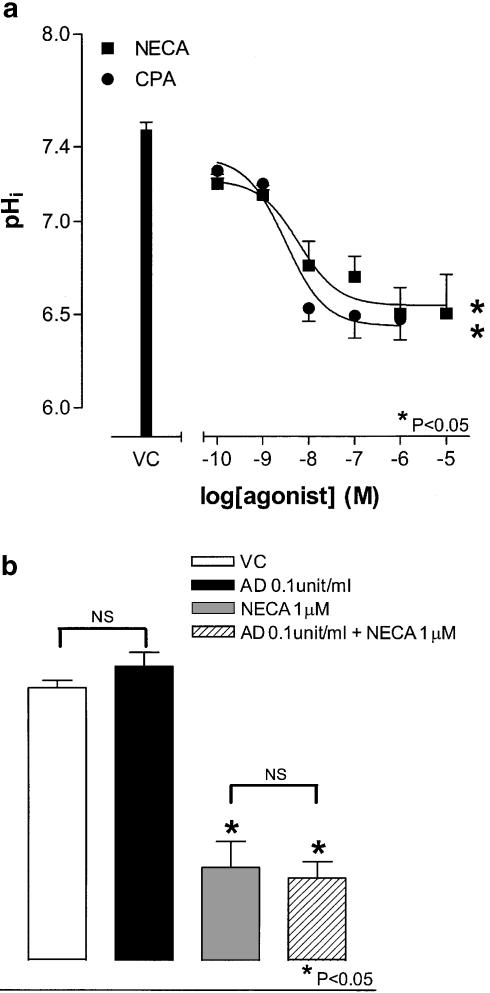
Figure 5.
Effects of NECA and CPA on pHi in HCPSC. Cells were incubated with the BCECF-AM (10 μM) prior to the addition of either agonist. Panel (a) shows the concentration response curves to NECA and CPA, measuring changes in pHi (30 min after agonist addition, n=6). Panel (b) shows the effect of adenosine deaminase (0.1 U ml−1) on the control pHi and the response to NECA (1 μM) (n=4 for both). *Significantly different when compared to vehicle control (VC) (P<0.05; one-way ANOVA). +Significantly different when compared to adenosine deaminase (AD 0.1 .U ml−1) (P<0.05, Bonferroni's test). NS, not significant.

