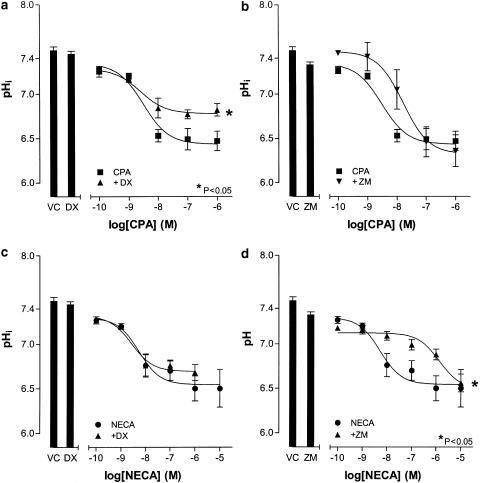
Figure 6.
Effects of DPCPX and Zm241385 on pHi changes elicited by NECA and CPA in HCPSC. Cells were incubated with either DPCPX (100 nM; DX), Zm241385 (100 nM; ZM) or vehicle control (VC) prior to the addition of NECA (100 pM–10 μM) or CPA (100 pM–1 μM). In all cases n=5. Panel (a) shows the effect of DPCPX (100 nM) on the concentration response curve to CPA (100 pM–1 μM). Panel (b) shows the effect of Zm241385 (100 nM) on the concentration response curve to CPA (100 pM–1 μM). Panel (c) shows the effect of DPCPX (100 nM) on the concentration response curve to NECA (100 pM–10 μM). Panel (d) shows the effect of Zm241385 (100 nM) on the concentration response curve to NECA (100 pM–10 μM) +Significantly different when compared to CPA (100 pM–1 μM) (P<0.05; two-way ANOVA). *Significantly different when compared to NECA (100 pM–10 μM) (P<0.05; two-way ANOVA). NS, not significant.

