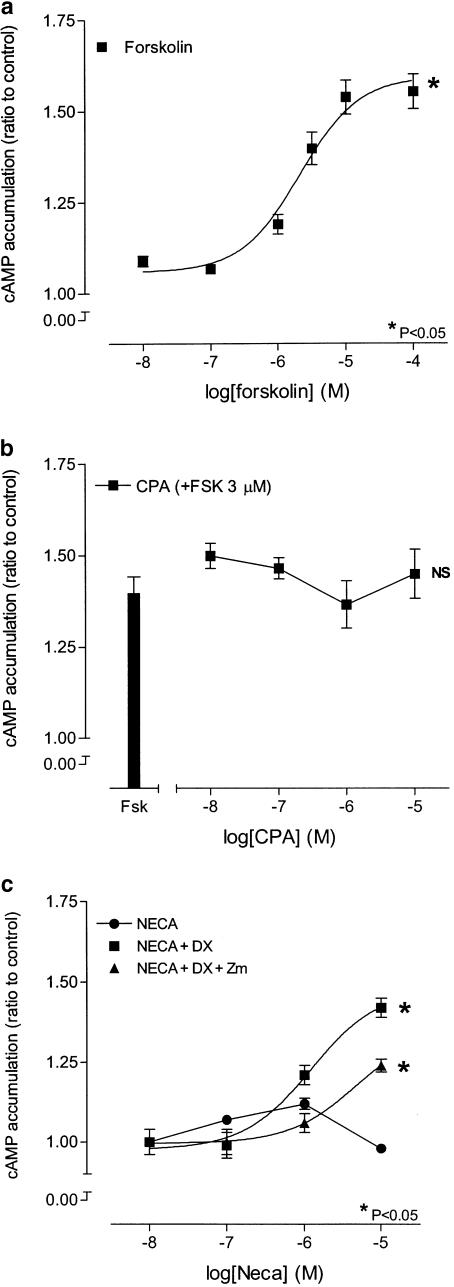
Figure 7.
Effects of forskolin, CPA and NECA on cAMP accumulation. Panel (a) shows the concentration response curve to forskolin. Panel (b) shows the effect of CPA on the cAMP accumulation elicited by a submaximal concentration of forskolin. Panel (c) shows the effect of NECA in the presence and absence of DPCPX (100 nM; DX) and/or Zm241385 (100 nM; ZM), in human cultured prostatic stromal cells. In all cases n=5. *Significant when compared to vehicle control (VC) (P<0.05; one-way ANOVA). +Significant when compared to NECA+DPCPX (P<0.05; two-way ANOVA). NS, not significant.

