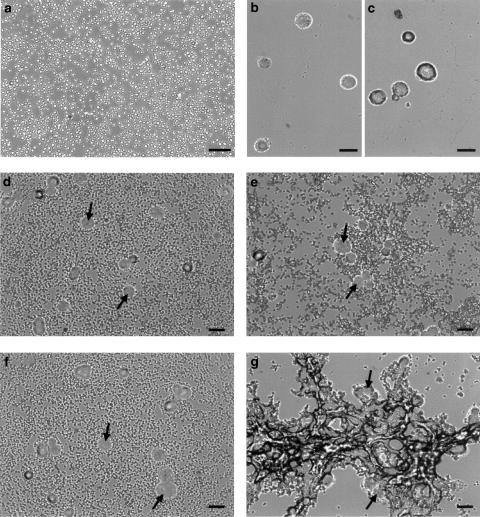
Figure 4.
Light microscopy of platelet–tumour cell aggregates. Phase-contrast photomicrographs of (a) resting platelets, (b) mock control MCF7-neo/zeo and (c) MCF7-β3/MT cells. Platelet–MCF7-neo/zeo and MCF-β3/MT cell aggregates were examined during shape change (d and e) and 50% maximal aggregation (f and g). Arrows indicate MCF7 cells. Scale bars=20 μm.

