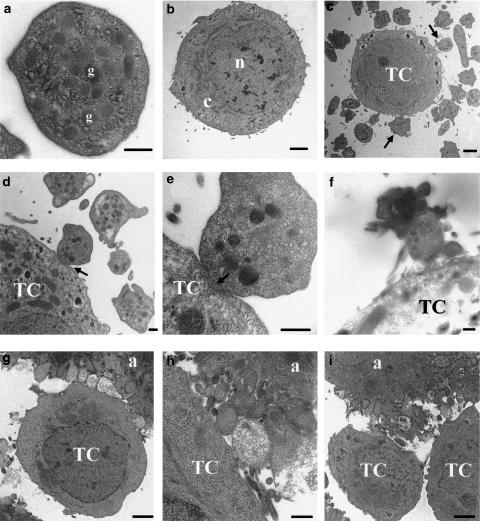
Figure 5.
Transmission electron microscopy of MCF7-β3/MT-induced aggregation. (a) High-power micrograph from a typical section of a resting platelet, with well-preserved granular structure (g). (b) Low-power micrograph showing an MCF7-β3/MT cell, with the nucleus (n) and cytoplasm (c). (c) Tumour cell surrounded by platelets (arrows) of various shapes (discoid forms without pseudopodia and spherical forms with pseudopodia). (d and e) Low- and high-power magnification of membrane–membrane heterotypic interactions between platelets and MCF7 cells (arrows). (f) Interactions between small platelet aggregates and tumour cell. (g and h) Large tight platelet aggregates associated with tumour cell membrane. (i) Heterotypic, tumour–platelet and homotypic, tumour–tumour, interactions. TC=tumour cell. a=platelet aggregates. Scale bars=500 nm (a, d, e, f, h), 2 μm (b, c, g).

