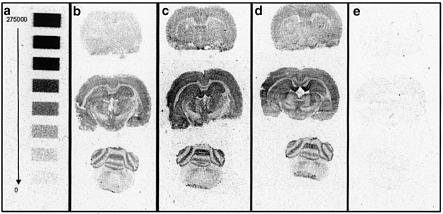
Figure 7.
Example autoradiograms showing (a) 14C calibration strip calibrated with disintegrations per minute (DPM) values from 275,000 DPM to 0 DPM (b) basal, (c) 1 μM HU210-treated slices, (d) 10 μM ODA-treated slices and (e) NSB. All examples are from the same experiment and show significantly enhanced [35S]GTPγS binding after treatment with HU210 or ODA.

