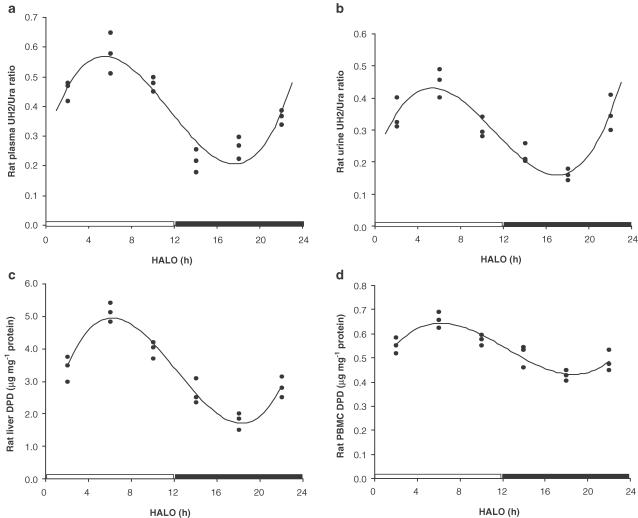
Figure 5.
Circadian rhythms of UH2/Ura ratios in rat plasma (a), UH2/Ura ratios in rat urine (b) and DPD levels in rat liver(c) and PBMCs (d). Data were obtained from the study in rats under the following conditions: lights on from 06:00 to 18:00 h, and lights off from 18:00 to 06:00 h. Three animals were used for each time point. The curves were computer-generated and analysed by ‘Cosinor' analysis. In order to emphasize the relationship between circadian pattern and light–dark cycle, the data were plotted by setting the abscissa from 0–24 HALO. 0–12 HALO, the period when light was on; 12–24 HALO, the period when lights were off.

