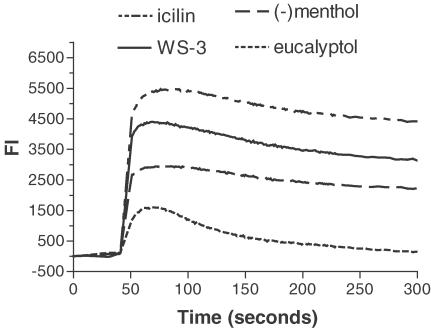
Figure 1.
[Ca2+]i responses to TRPM8 agonists. [Ca2+]i fluxes induced by icilin (5 μM), WS-3 (30 μM), (−)menthol (30 μM) and eucalyptol (5 mM) were monitored using the FLIPR® assay in mTRPM8-transfected HEK293 cells. [Ca2+]i responses were measured as changes in fluorescence intensity (FI) before and after the addition of agonists. The data shown are representative plots of the fluorescence signals against time during assays.

